Tubercle-Modified NACA 0012
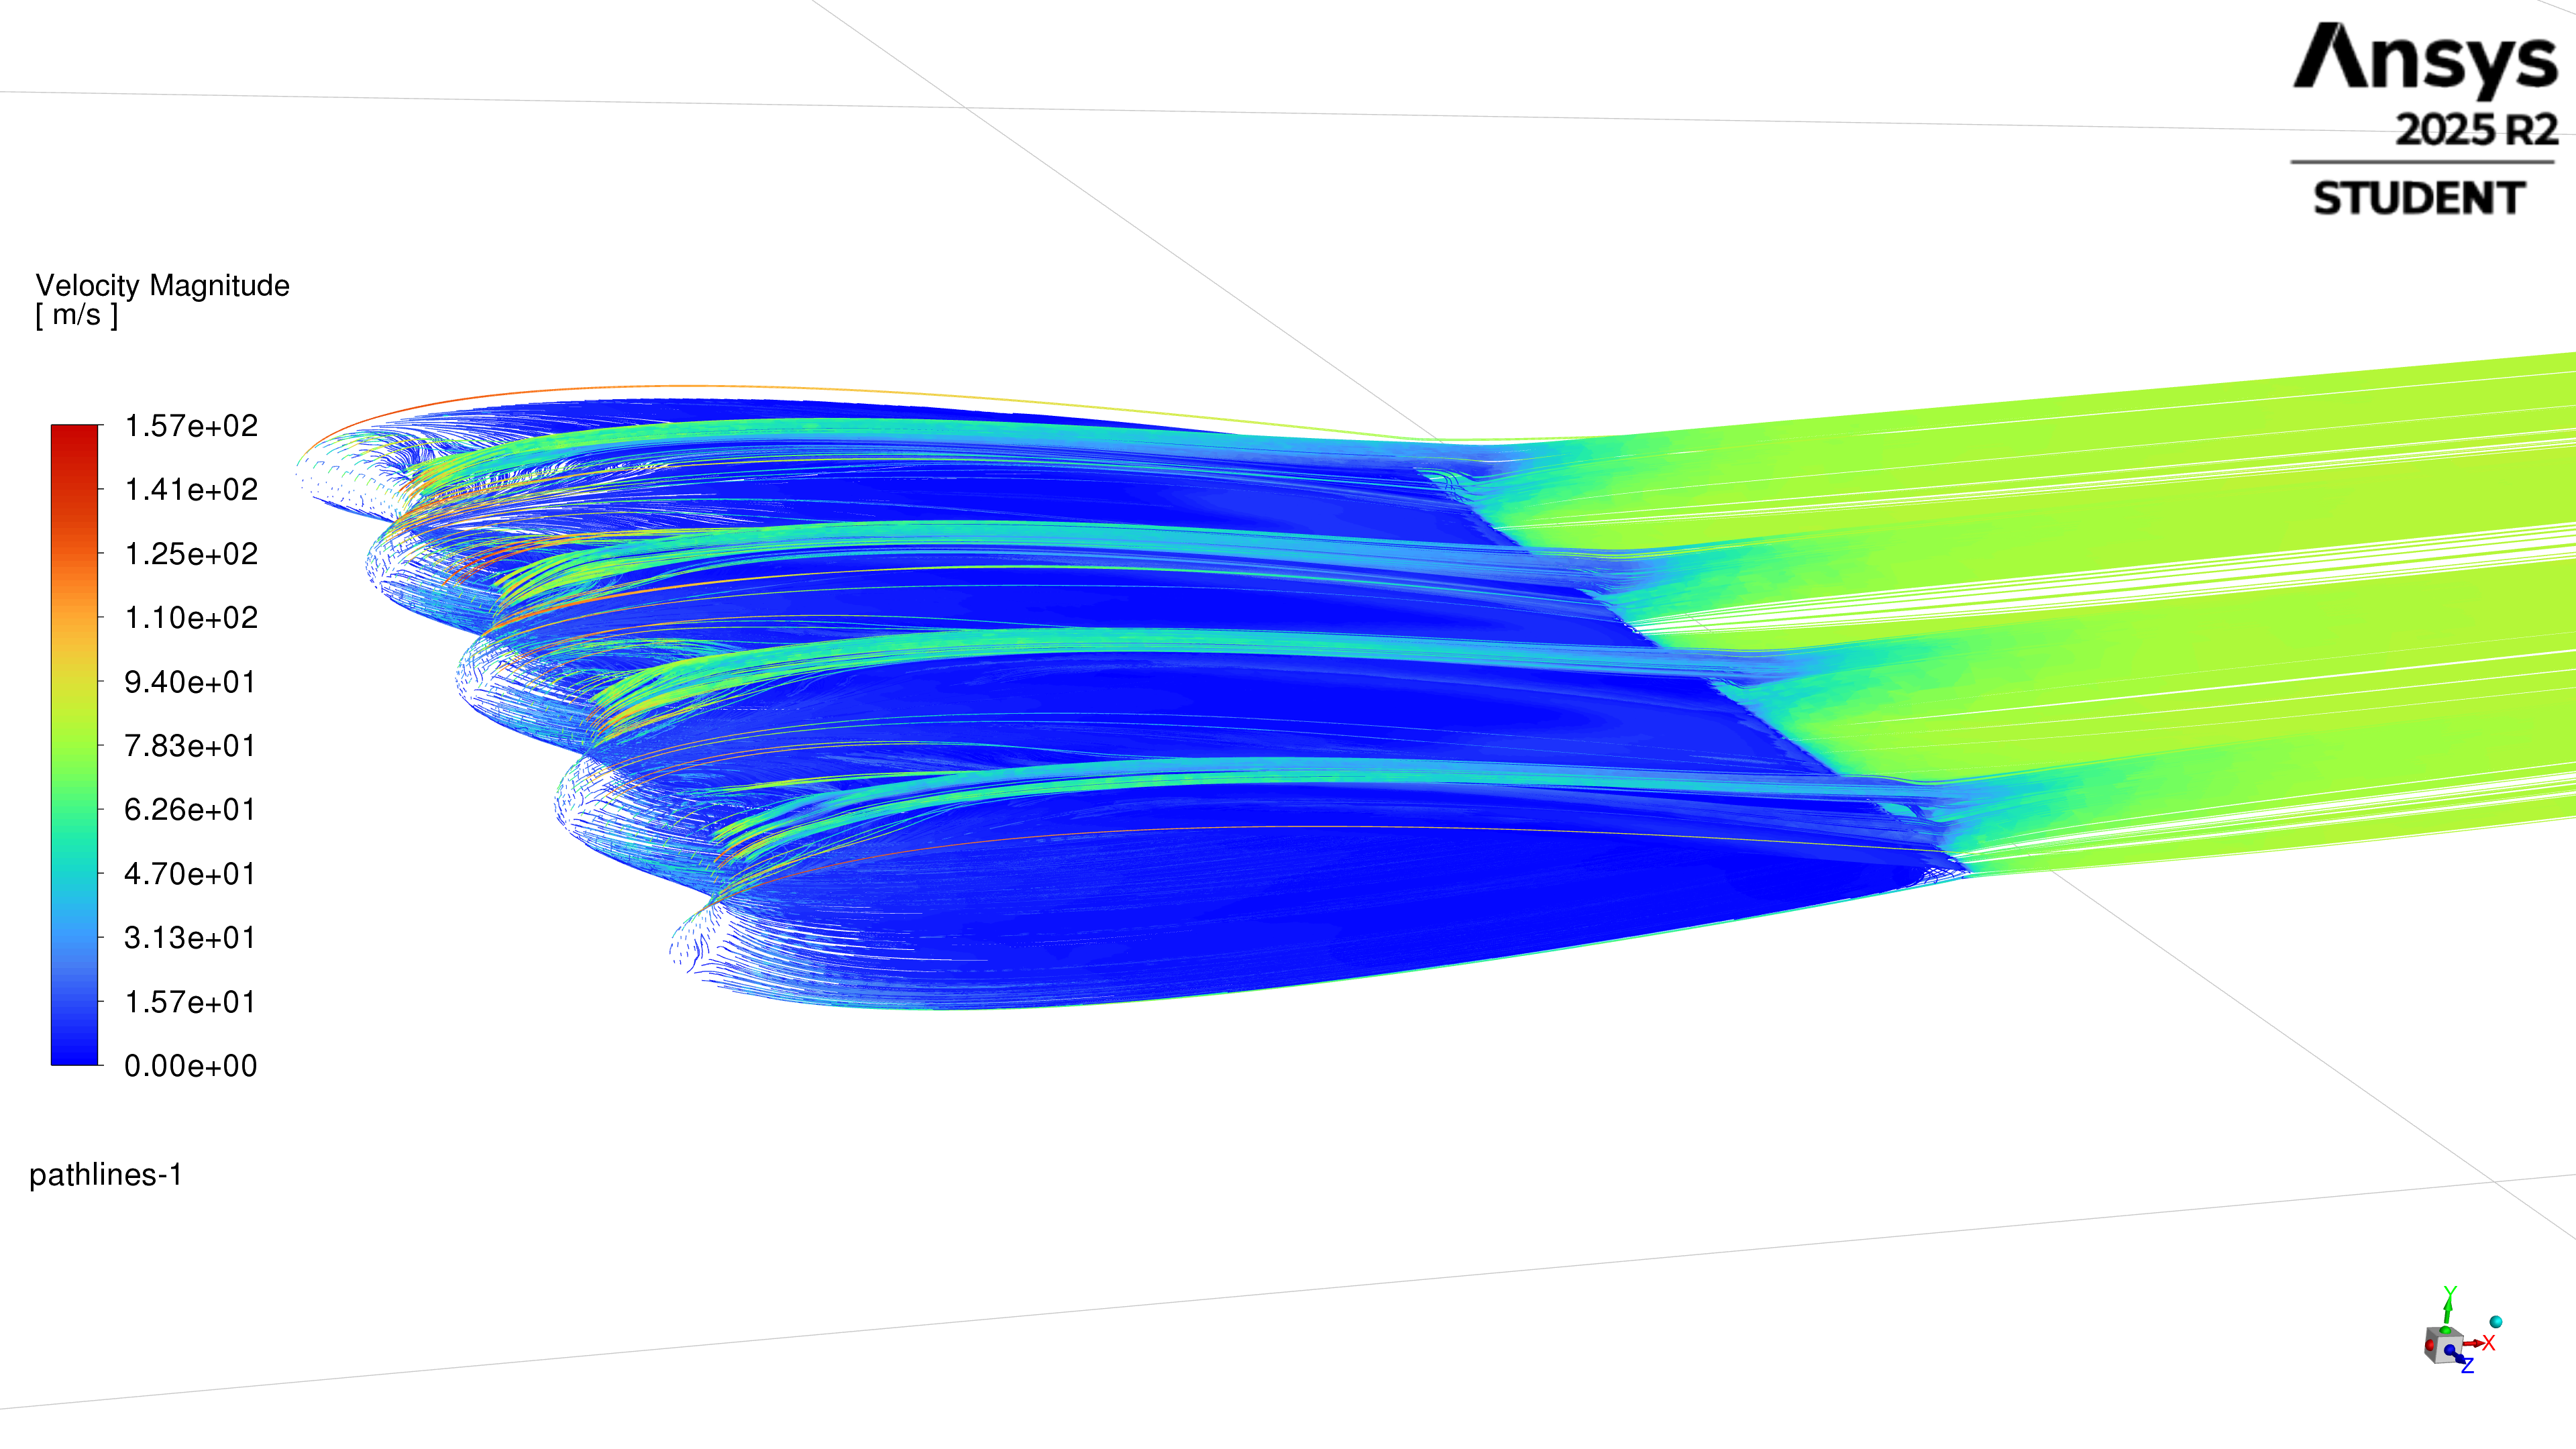
Humpback whales have bumps along the leading edge of their flippers, called tubercles. They create spanwise vortices and delay stall. Literature says that these can be applied to airfoils to better performance, but I noticed a gap in Reynolds number studies. So I swept three Reynolds numbers regimes to test the tubercle effect.
The results disagree on any Reynolds dependence. Some say there is none, some say it increases, some say it decreases. Additionally, the studies ignore a critical flight regime that is becoming all the more relevant with the expansion of UAV technology, the transitional regime.
Methods
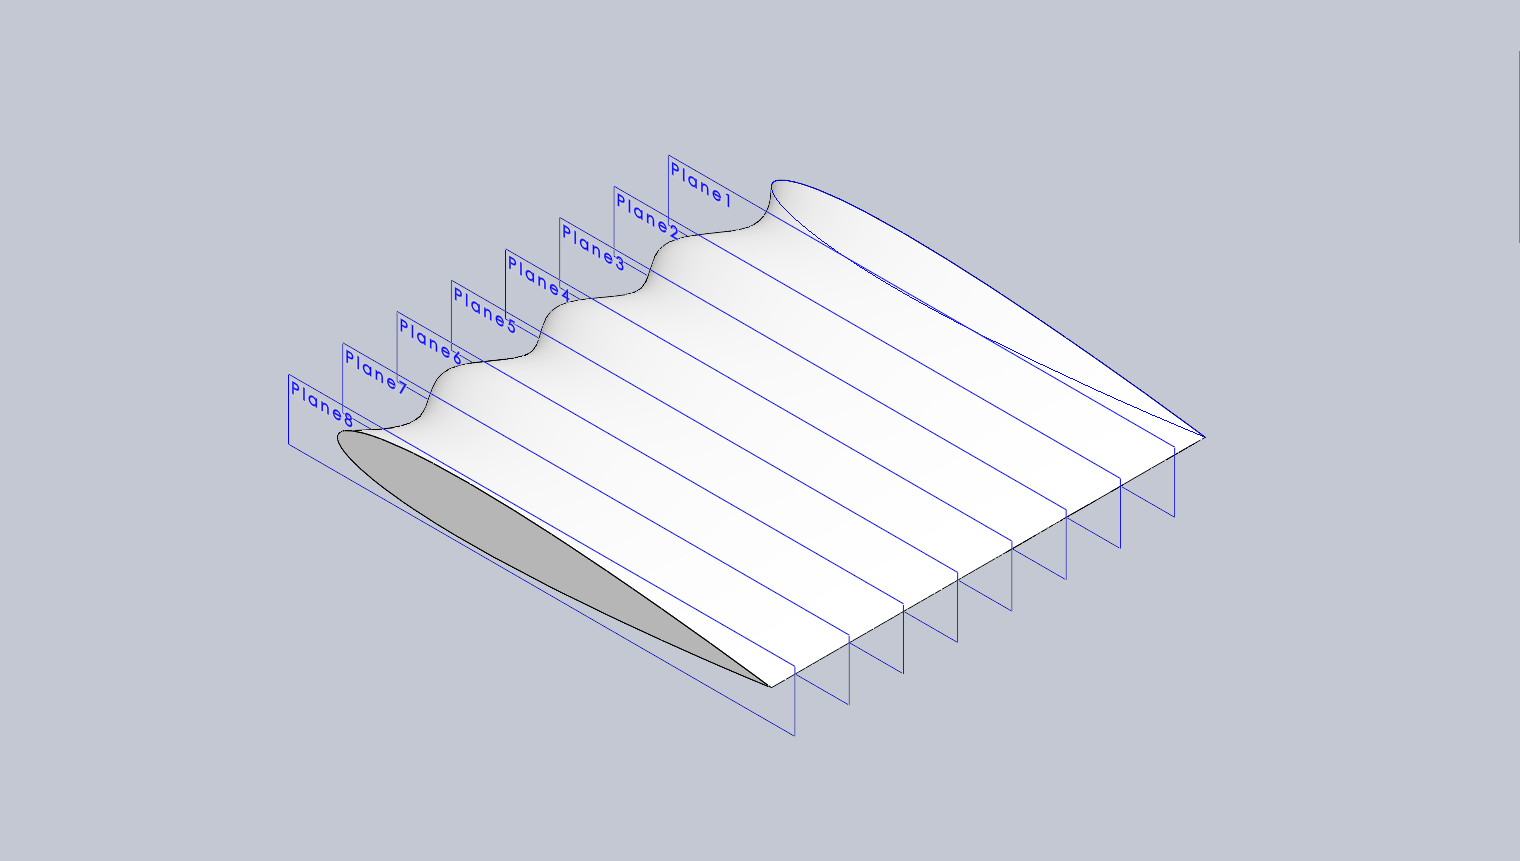
Two 0.25 m chord NACA 0012 sections, one baseline and one tubercle-modified, were simulated in ANSYS Fluent 2025 R2 Student using the four-equation Langtry–Menter Transition SST (γ–Reθ) model. The leading edge follows a cosine profile, f(x) = a cos(2πx/λ), with amplitude a = 0.03c (7.5 mm) and wavelength λ = 0.25c (62.5 mm), matching the geometry used by Bardera et al. (2024).
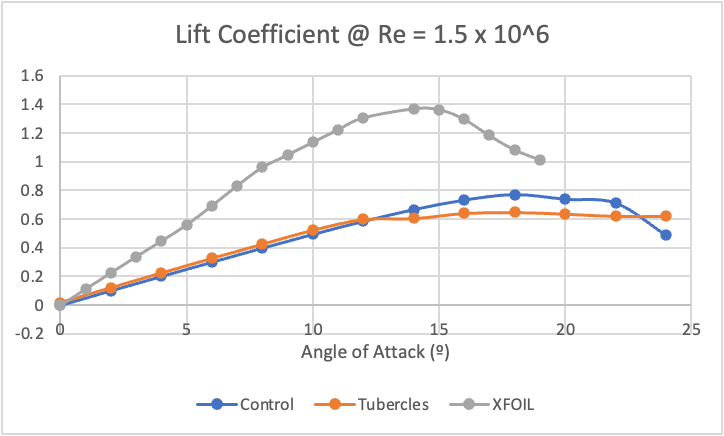
Each configuration ran at 13 angles of attack, 0° to 24° in 2° increments, across three Reynolds numbers: 1×10⁵ (laminar, 5.843 m/s), 5×10⁵ (transitional, 29.215 m/s), and 1.5×10⁶ (turbulent, 87.644 m/s). 78 runs total. The domain extends 10c upstream as a semicircle and 20c downstream. Meshes were 923,646 elements (control) and 916,225 (tubercle), with a first-layer height of 0.000025 m and 15 inflation layers at 1.2 growth, yielding y+ = 0.172 and 0.184 respectively. Inlet turbulence intensity was 0.1%. A coupled solver ran 500 iterations per case. I plotted the lift curves against XFOIL as a trend-match, not a one to one comparison.
Results
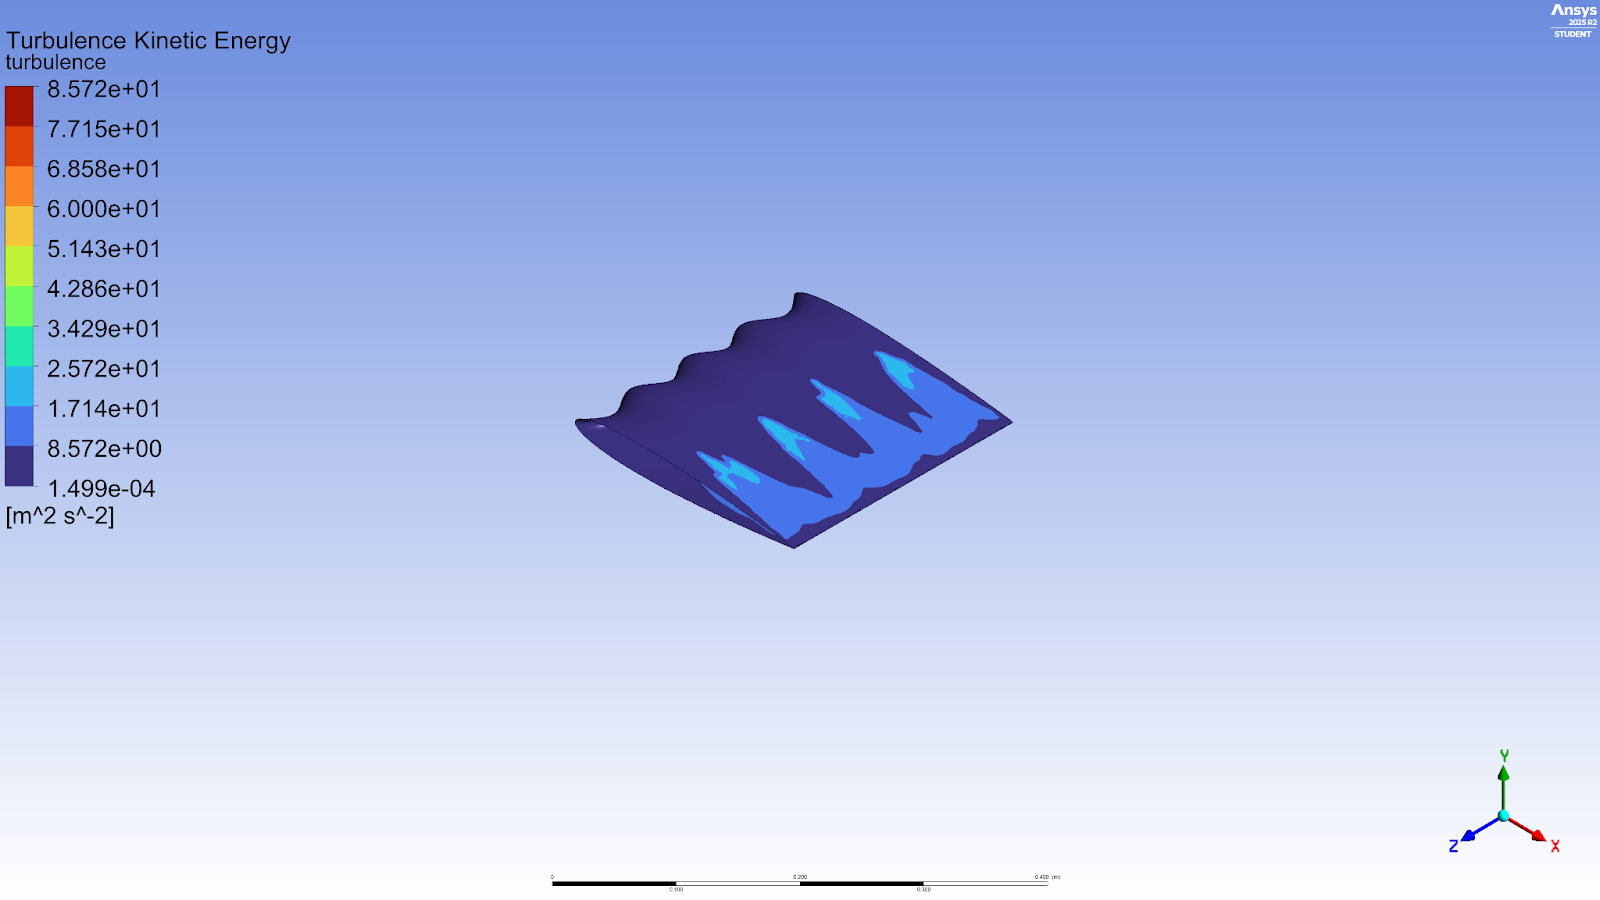
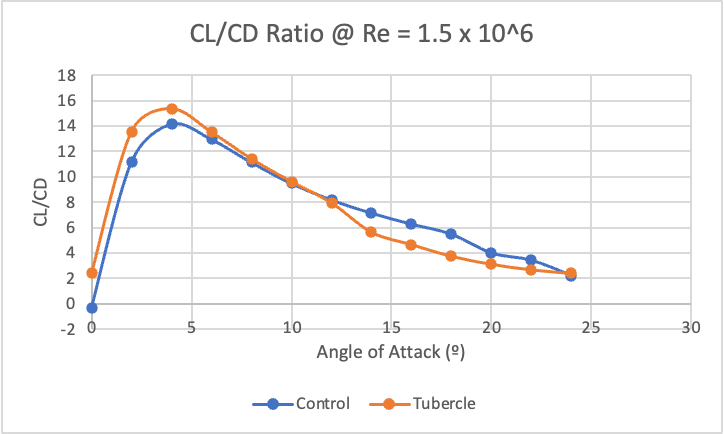
The tubercle effect is non-monotonic. In the laminar case the tubercles hurt performance significantly. In the other two they help, and they help most at the highest Reynolds number. Values below are at 4° angle of attack, against the unmodified control. Once the angle of attack exceeds a certain threshold, the tubercle effect becomes negative again, in all cases. This is due to the tubercles increasing the local turbulence on the upper surface of the airfoil, which in turn increases the drag coefficient and lowers the L/D ratio.
CL −25.88% · CD +28.66% · efficiency −24.41%
CL +8.56% · CD +3.31% · efficiency +5.08%
CL +12.06% · CD +3.55% · efficiency +8.23%
Stall behavior changed in every case. The control section stalls at 22°. The tubercle section holds lift through 22° and 24°.
So the Reynolds dependence is non-monotonic, and the benefit is specific to the regime. That may be part of why published results disagree. Studies reporting harm tend to sit below Re ≈ 3×10⁵ and studies reporting benefit above Re ≈ 5×10⁵.
Limitations
This is the most important aspect of a purely computational study. The RANS solvers are, by nature, averages, and they minimize the effects of unsteady flow phenomena. Additionally, the constraints within Ansys Student limit the mesh fidelity considerably.
The spanwise boundary conditions prevent wingtip vortices from forming. This isolates the tubercle and airfoil interaction, but it also means the results only apply to high aspect ratios and effectively infinite spans. They should not be carried over to a finite-wing UAV without a separate wingtip analysis.
Langtry Menter Transition SST underpredicts CL and overpredicts CD against XFOIL, and gets unreliable above 16°. RANS averages out unsteady behavior that matters once the flow separates. The same offset shows up in Bardera et al. (2024) and Ali et al. (2024), so I read it as a limit of the model rather than a mistake in my setup. It was reassuring to see that peer-reviewed literature observes the same phenomena.
The 1×10⁻⁵ residual criterion was not met. Residuals stabilized with small oscillation after roughly 100 iterations, and reported values are averages over the final 200 iterations to reduce uncertainty. Laminar-to-turbulent transition on the upper surface is difficult to resolve at this mesh density and contributes to the coefficient underprediction.
The Fluent Student Edition caps the mesh at one million cells. Most of that budget goes to the inflation layer to keep y+ below 1, which leaves less for the far field. A refinement zone downstream helps with resolving the drag coefficient, but there are inherent diminishing returns in the refinement choices.
A single tubercle amplitude and wavelength were tested, so nothing here generalizes across tubercle geometries. The NACA 0012 airfoil was intentionally chosen to isolate the tubercle effect from camber effects, but this prevents generalizability.
Tools
ANSYS Fluent, SolidWorks, Autodesk Fusion 360, XFOIL.